
OLS
Regression analysis is a powerful statistical tool widely used in various fields such as economics, finance, social sciences, and more. Among the different regression techniques, Ordinary Least Squares (OLS) regression stands out as one of the most commonly employed methods. OLS regression provides a systematic way to analyze the relationship between one dependent variable and one or more independent variables. In this comprehensive guide, we delve into the fundamentals of OLS regression, its assumptions, application, interpretation, and potential pitfalls.
Understanding OLS Regression:
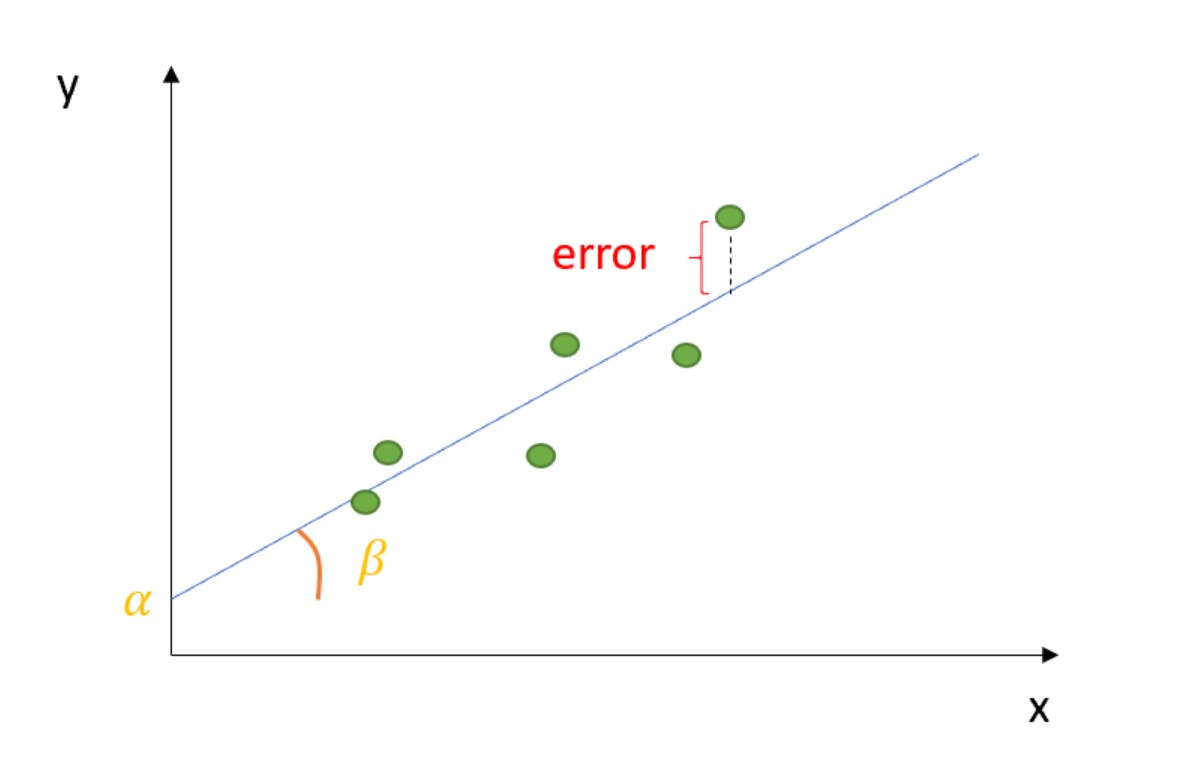
At its core, OLS regression aims to find the line that best fits a set of data points. This line is determined by minimizing the sum of the squared differences between the observed values and the values predicted by the regression line. The equation for a simple linear regression model, where there is only one independent variable, can be represented as:
�=�0+�1�+�Y=β0+β1X+ε
Where:
- �Y is the dependent variable,
- �X is the independent variable,
- �0β0 is the intercept term (constant),
- �1β1 is the slope coefficient, and
- �ε represents the error term.
The goal of OLS regression is to estimate the coefficients �0β0 and �1β1 in such a way that the sum of squared residuals (the vertical distance between the observed and predicted values) is minimized.
Assumptions of OLS Regression:
OLS regression relies on several key assumptions for its validity:
- Linearity: The relationship between the dependent and independent variables is linear.
- Independence: Observations are independent of each other.
- Homoscedasticity: The variance of the error terms is constant across all levels of the independent variables.
- Normality: The error terms are normally distributed.
- No perfect multicollinearity: Independent variables are not perfectly correlated with each other.
Violation of these assumptions can lead to biased and inefficient parameter estimates, affecting the reliability of the regression analysis.
Application of OLS Regression:
OLS regression finds application in various fields, including economics, finance, sociology, and epidemiology, among others. Some common applications include:
- Economic Forecasting: OLS regression is frequently used to analyze the relationship between economic variables such as GDP, inflation, and unemployment.
- Market Research: Companies use OLS regression to understand the factors influencing consumer behavior and market demand.
- Health Studies: Researchers employ OLS regression to investigate the impact of lifestyle factors, medical interventions, and socio-economic variables on health outcomes.
Interpretation of OLS Regression Results:
Once the OLS regression model is estimated, it’s essential to interpret the results correctly. Key aspects to consider include:
- Coefficients: The coefficients represent the estimated effect of the independent variables on the dependent variable. For instance, in a model predicting sales based on advertising expenditure, a coefficient of 0.5 for advertising expenditure implies that a one-unit increase in advertising spending leads to a 0.5-unit increase in sales, holding other variables constant.
- R-squared: The R-squared statistic measures the proportion of variance in the dependent variable explained by the independent variables. A higher R-squared value indicates a better fit of the model to the data.
- Standard Errors: Standard errors provide information about the precision of the coefficient estimates. Smaller standard errors indicate more precise estimates.
- Hypothesis Testing: Hypothesis tests, such as t-tests or F-tests, are conducted to determine whether the coefficients are statistically significant.
Potential Pitfalls of OLS Regression:
While OLS regression is a powerful tool, it’s important to be aware of its limitations and potential pitfalls:
- Outliers: Outliers can disproportionately influence the regression results, leading to biased estimates. Robust regression techniques or data transformation methods may be employed to mitigate the impact of outliers.
- Multicollinearity: High multicollinearity among independent variables can inflate the standard errors of the coefficient estimates, making them less reliable. Techniques such as variance inflation factor (VIF) analysis can help detect multicollinearity.
- Heteroscedasticity: Violation of the homoscedasticity assumption can lead to inefficient parameter estimates and incorrect inference. Robust standard errors or heteroscedasticity-consistent standard errors can be used to address this issue.
Conclusion:
Ordinary Least Squares (OLS) regression is a fundamental statistical technique used to analyze the relationship between variables. By minimizing the sum of squared differences between observed and predicted values, OLS regression provides estimates of the coefficients that best fit the data. However, it’s crucial to ensure that the assumptions of OLS regression are met and to interpret the results correctly to derive meaningful insights. While OLS regression has its limitations, understanding its principles and potential pitfalls is essential for conducting reliable and robust regression analysis in various fields.